NicheNet Analysis
Preface
IMPORTANT
NicheNet is an analytical tool that can infer ligand-target gene regulation in receptor cells from expression data and prior knowledge, suitable for cell communication studies in single-cell and spatial transcriptomics data.
This training document is for bioinformatics analysts and biologists using the SeekSoul™ Online platform, aiming to introduce NicheNet's principles, common parameter settings, result interpretation, and operation key points on the platform.
NicheNet Theoretical Basis
Core Assumptions
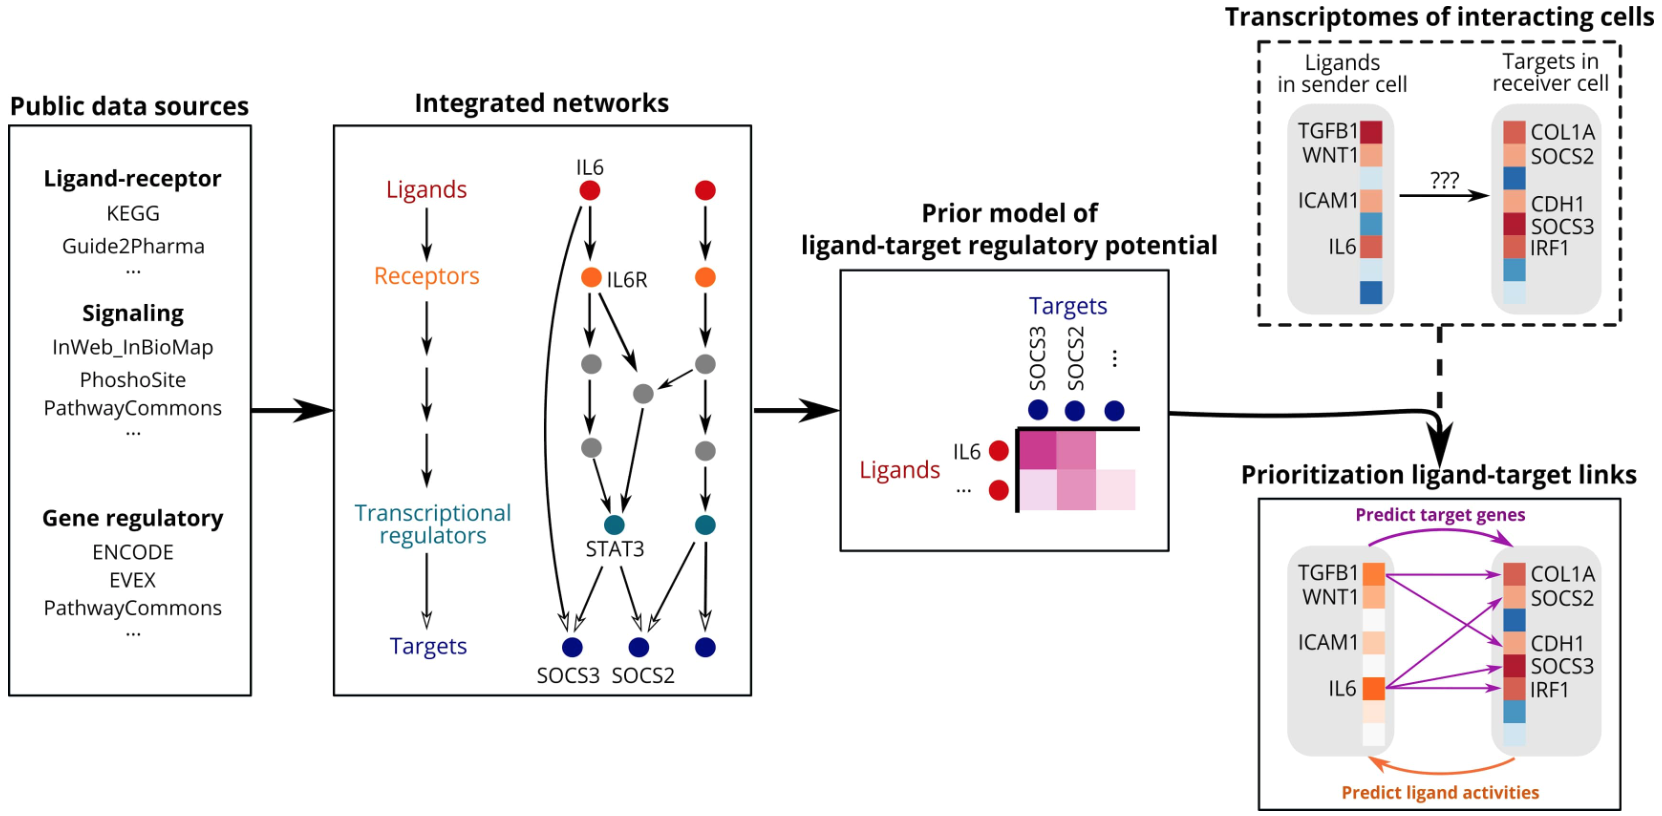
NicheNet is based on the following assumptions: Ligands bind to receptors, trigger intracellular signal transduction in receptor cells, and ultimately affect transcription factors and regulate the expression of specific target genes. Therefore, to infer ligand regulation of target genes, NicheNet integrates ligand-receptor, signal transduction, and transcriptional regulatory networks into a prior model.
Data Integration
NicheNet primarily integrates:
- Ligand-receptor interaction databases (known L-R pairs)
- Protein-protein interaction and signal transduction networks (receptor → signaling proteins → TFs)
- Transcription factor-target gene regulatory networks
This information is integrated into weighted networks, and network propagation algorithms are used to calculate each ligand's regulatory potential score to candidate target genes.
NOTE
The network propagation algorithm is the core innovation of NicheNet. It simulates signal propagation strength attenuation and multi-pathway synergistic effects in the network, thereby deriving the regulatory potential of ligands on target genes.
Scoring and Statistical Evaluation
Common metrics: AUROC, AUPR, AUPR_corrected (for unbalanced data correction), Pearson correlation coefficient. NicheNet typically uses aupr_corrected as the main basis for ligand activity ranking.
Technical Implementation
Algorithm Workflow (Overview)
- Data preprocessing: Expression matrix normalization, cell annotation, and quality control
- Differential gene analysis: Identify interested target gene sets in receptor cells
- Ligand candidate selection: Screen potential ligands based on expression and biological priors
- Ligand activity analysis: Calculate and rank ligand regulatory potential on target gene sets based on network propagation
- Target gene prediction: Predict high-confidence target genes for TOP ligands and visualize
Differences Between Single-Cell and Spatial Data
| Data Type | Preprocessing Focus | Analysis Recommendations |
|---|---|---|
| Single-cell RNA-seq | Cell clustering and annotation, batch correction | Use cell type groups as sender/receiver units |
| Spatial transcriptomics | Preserve spatial coordinates, section quality control | Only consider spatially neighboring cells as senders/receivers to reduce false positives |
WARNING
Spatial data must consider cell proximity. Direct communication between distant cells is less likely, avoid blindly using all cells as senders.
Parameter Recommendations (Empirical Rules)
- Expression threshold: Genes expressed in >=10% of cells in the cell type (can be reduced to 5-8% for spatial data)
- Differential gene filtering: log2FC 0.25–1.0, p < 0.05, pct > 0.1
- Target gene number: 50–500 differential genes recommended to balance signal and noise
TIP
For rare cells or low-coverage data, expression thresholds can be appropriately relaxed or downsampling strategies can be adopted.
SeekSoul™ Online Operation Guide
Parameter Configuration Interface (Overview)
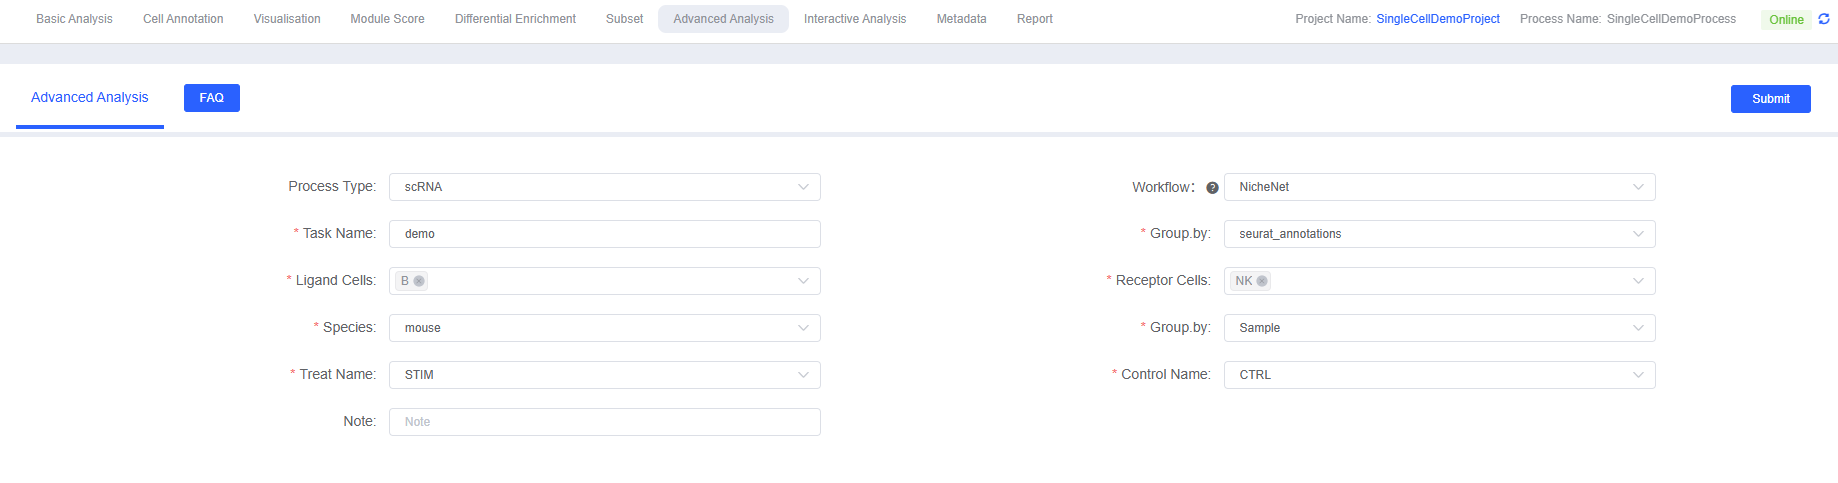
Main Parameter Explanations
- Task Name: Starts with English letters, can include underscores and Chinese, with semantic meaning recommended (e.g.,
nichenet_analysis_2025) - Group.by: Cell annotation column name (e.g.,
celltypeorCellAnnotation) - Ligand Cells (Senders): Multiple selection, 2–5 cell types with secretory functions recommended
- Receptor Cells (Receivers): Multiple selection, 1–3 target cell types of interest recommended
- Group.by: Column name for processing group/control group (e.g.,
Condition) - Treat Name vs Control Name: Setting for differential gene analysis
- Species: Select
humanormouse, affecting prior models and gene symbols
Parameter Filling Recommendations (Platform Practice)
IMPORTANT
Ligand cell selection strategy: Prioritize cells known to have secretory functions (immune cells, stromal cells, fibroblasts, etc.), avoid including non-nucleated cells such as red blood cells.
IMPORTANT
Receptor cell selection strategy: Select target cell types of interest (such as tumor cells, epithelial cells), and ensure sufficient sample size in group comparisons.
Submission and Viewing: Usually takes 30–60 minutes after submission (depending on data scale). After completion, reports and image files can be downloaded from the analysis list.
Result Interpretation
Main Output Files
*_ligand_activities.txt: Ligand activity scores (aupr_correctedas the main ranking basis)*_top_ligands.txt: Top ligand list (usually Top30)*_top_targets.txt: Predicted target gene list- Visualization files:
*_Top_ligands_dot.png,*_ligands_heatmap.png,*_ligand_target_heatmap.png,*_ligand_receptor_heatmap.png,*_ligand_target_circos.png
Ligand Activity Table Interpretation
| Column Name | Meaning |
|---|---|
test_ligand | Ligand gene name |
auroc | Model AUROC score |
aupr | AUPR score |
aupr_corrected | AUPR corrected for unbalanced data (primary sorting basis) |
pearson | Pearson correlation between prediction and observation |
rank | Rank based on aupr_corrected |
NOTE
aupr_corrected is more suitable for single-cell scenarios, prioritizing this indicator for ligand priority determination.
Key Points for Interpreting Common Charts
- Bubble chart (ligand expression): Point size represents expression proportion in cells, color represents expression level.
- Ligand differential expression heatmap: Shows differential expression (log2FC) of treatment/control groups in each cell type.
- Ligand-target gene regulation heatmap: Darker colors indicate stronger predicted regulatory potential.
- Ligand-receptor heatmap: Used to verify biological rationality and screen possible ligand-receptor pairs.
- Circos plot: Shows predicted connections between ligands and target genes, line thickness reflects regulation strength.
Screening Strategies (Experience)
- Preferred: Ligands with high
aupr_correctedand expression in ligand cells and whose receptors are expressed in receptor cells - Combine biological background and literature, prioritize ligands with relevant functions and verifiable through experiments
Application Cases (Example Summary)
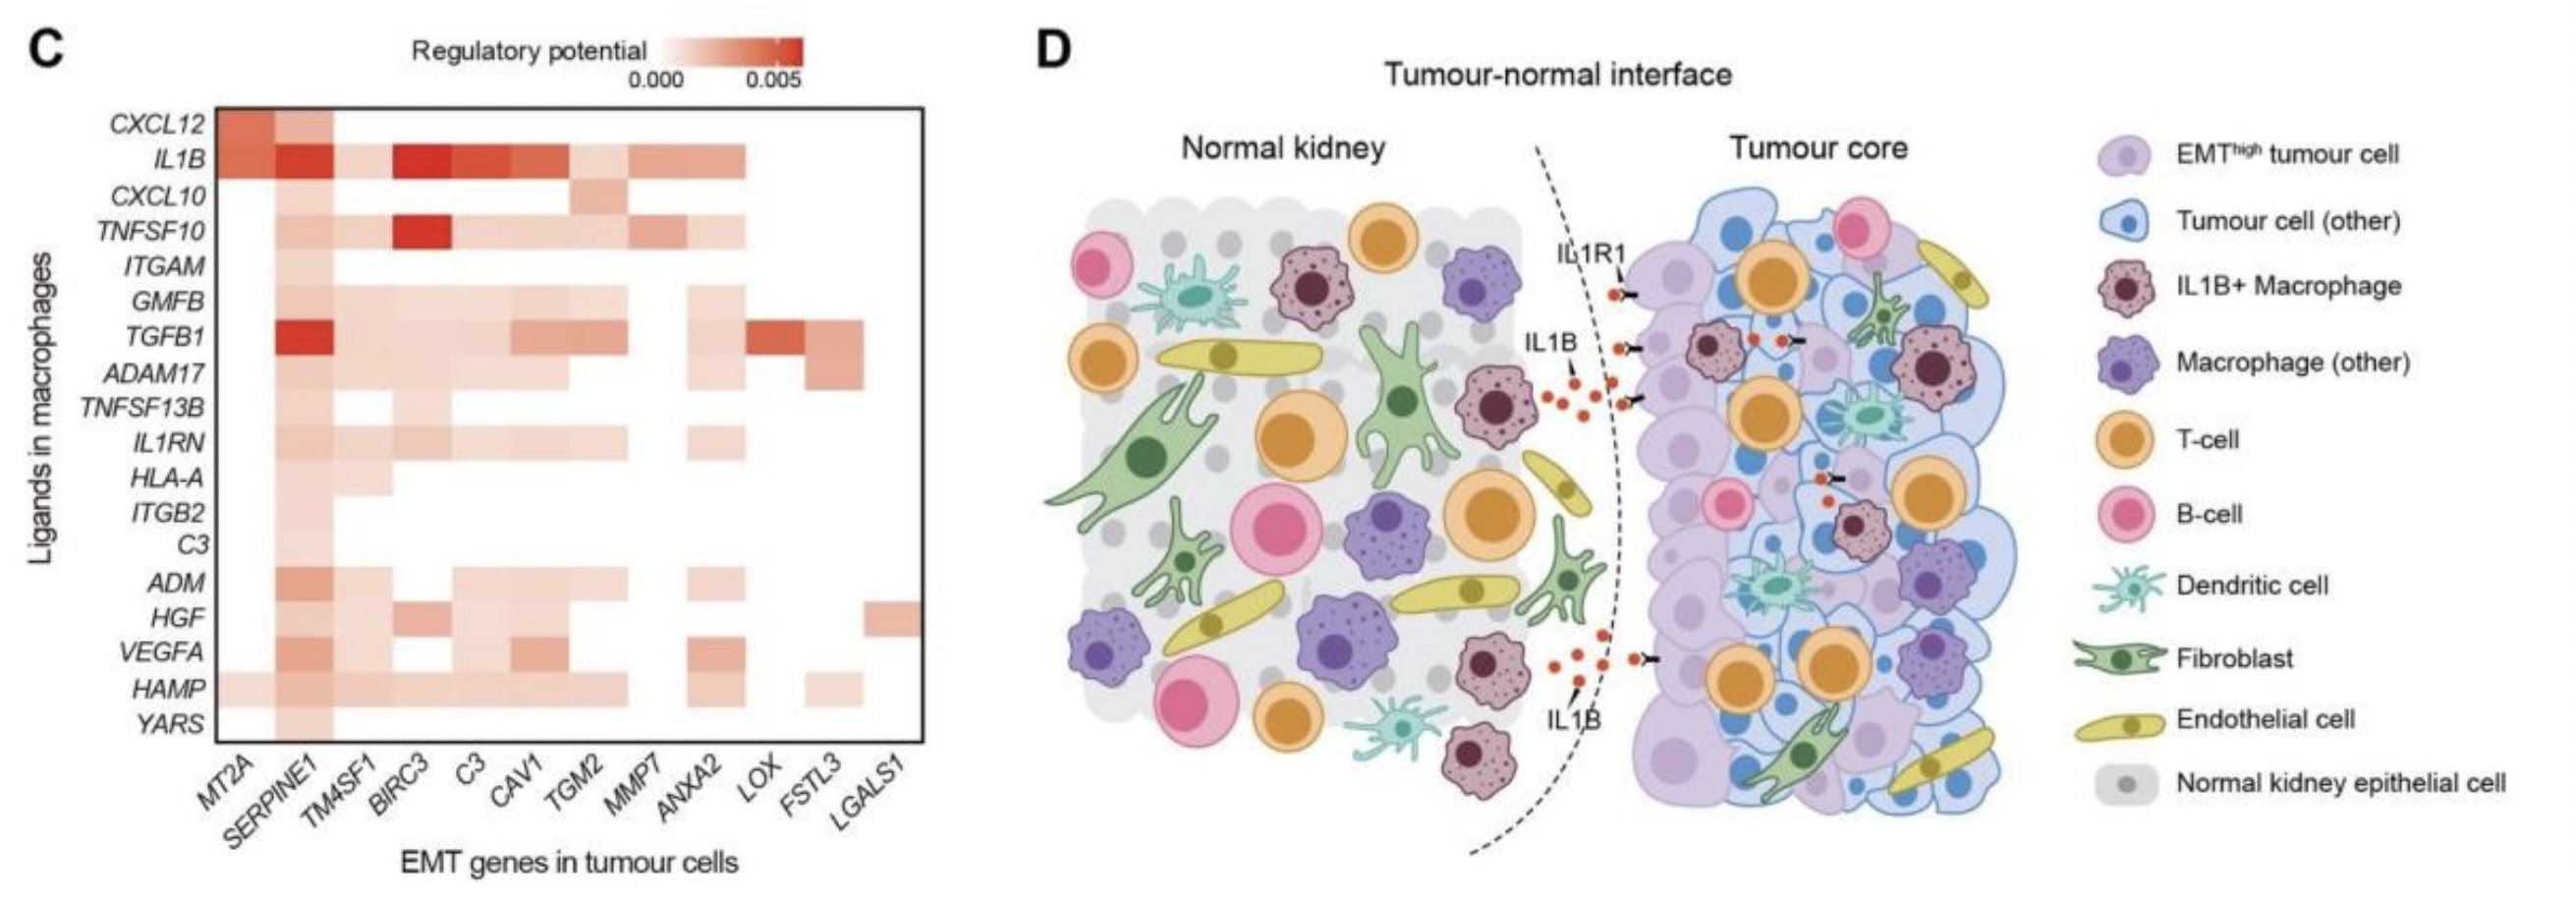
Case: Renal Cell Carcinoma (RCC) Tumor-Microenvironment Interaction Analysis (Brief)
- Problem: Identify cell communication signals promoting EMT at the tumor-non-tumor boundary
- Ligand Cells: Macrophage
- Receptor Cells: Tumor cells
Key Findings: Ligands expressed by macrophages (such as IL1B) have significant regulatory potential on EMT target genes in tumor cells, and the receptor IL1R1 is highly expressed in tumor cells, suggesting the IL1B/IL1R1 pathway may be involved in tumor invasion.
TIP
In case analysis, it is recommended to combine spatial location and immune phenotype to verify prediction results, improving conclusion credibility.
Precautions and Best Practices
Data and Quality Control
WARNING
Cell number requirements: At least 50 cells per cell type recommended; can be appropriately relaxed for rare cells.
WARNING
Gene expression requirements: Ligand and receptor genes need to be expressed in corresponding cell types, otherwise predictions may be false positives.
Parameters and Result Screening
- Ligand activity screening:
aupr_corrected > 0.1as a reference threshold; auxiliary referenceauroc > 0.6 - Target gene screening: Prioritize genes with high regulatory potential and relevant functions, combined with enrichment analysis to judge biological consistency
Common Misunderstandings
WARNING
Avoid choosing too many ligand/receptor cell combinations, as too many combinations will increase noise and reduce interpretability.
WARNING
NicheNet is a predictive tool, all key conclusions should be combined with literature and experimental verification.
Frequently Asked Questions
Q1: How to select ligand/receptor cells?
A: Ligand cells should prioritize cells with known secretory functions (immune cells, stromal cells, etc.), receptor cells are target cells of research interest, and both should possibly interact spatially.
Q2: What if ligand activity is low?
A: Check ligand/receptor expression, relax differential gene thresholds, or consider other cell combinations.
Q3: How to judge prediction reliability?
A: Combine aupr_corrected, ligand/receptor expression evidence, GO/KEGG enrichment, and literature/experimental verification.
References
- Browaeys R, Saelens W, Saeys Y. NicheNet: modeling intercellular communication by linking ligands to target genes. Nat Methods. 2020;17(2):159-162.
- Efremova M, Vento-Tormo M, Teichmann SA, Vento-Tormo R. CellPhoneDB: inferring cell–cell communication from combined expression of multi-subunit ligand–receptor complexes. Nat Protoc. 2020.